Which of the following graph truly represents the titration of CH3COOH solution against solution? — Electrochemistry Chemistry Question
Question
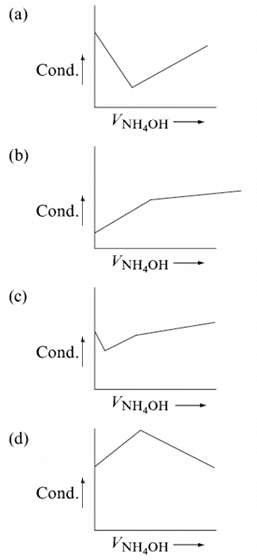
Which of the following graph truly represents the titration of CH3COOH solution against $NH_4OH$ solution?
💡 Solution & Explanation
Step 1 - Analyze the Nature of the Reacting Species We are titrating a weak acid, acetic acid ($\ce{CH3COOH}$), against a weak base, ammonium hydroxide ($\ce{NH4OH}$). Both reactants are weak electrolytes that dissociate only partially in aqueous solutions: * **Acetic Acid:** $\ce{CH3COOH(aq) <=> CH3COO^-(aq) + H^+(aq)} \quad (K_a \approx 1.8 \times 10^{-5})$ * **Ammonium Hydroxide:** $\ce{NH4OH(aq) <=> NH4^+(aq) + OH^-(aq)} \quad (K_b \approx 1.8 \times 10^{-5})$ The neutralization reaction between them forms ammonium acetate ($\ce{CH3COONH4}$) and water: $$\ce{CH3COOH(aq) + NH4OH(aq) -> CH3COO^-(aq) + NH4^+(aq) + H2O(l)}$$ Unlike the weak reactants, the product ammonium acetate ($\ce{CH3COONH4}$) is a salt and behaves as a **strong electrolyte** in aqueous solution, dissociating completely into free $\ce{CH3COO^-}$ and $\ce{NH4^+}$ ions. Step 2 - Analyze the Initial Conductance (Before Adding Base) At the start of the titration, the flask contains only the pure weak acid $\ce{CH3COOH}$. Because of its low degree of ionization ($\alpha \ll 1$), the concentration of free $\ce{H^+}$ and $\ce{CH3COO^-}$ ions is very low. Consequently, the initial electrical conductance of the solution is **low**. Step 3 - Analyze the Conductance Up to the Equivalence Point (Neutralization Phase) As the weak base $\ce{NH4OH}$ is added, it reacts with the un-ionized $\ce{CH3COOH}$ molecules to produce the strong electrolyte $\ce{CH3COONH4}$: $$\ce{CH3COOH(aq) + NH4^+(aq) + OH^-(aq) -> CH3COO^-(aq) + NH4^+(aq) + H2O(l)}$$ In this phase: * The non-conducting neutral molecules of acetic acid are converted into highly conducting free ions ($\ce{CH3COO^-}$ and $\ce{NH4^+}$). * The total number of ions in the solution increases continuously. * Therefore, the electrical conductance of the solution **increases steadily and linearly** up to the equivalence point. Step 4 - Analyze the Conductance Beyond the Equivalence Point (Excess Phase) Once all the acetic acid is completely neutralized, any further addition of $\ce{NH4OH}$ introduces excess weak base into the solution. The dissociation of this excess $\ce{NH4OH}$ is strongly suppressed by the high concentration of ammonium ions ($\ce{NH4^+}$) already present in the solution due to the **common ion effect**: $$\ce{NH4OH(aq) <=> \underset{\text{From salt}}{\ce{NH4^+}}(aq) + OH^-(aq)}$$ Because of this suppression: * No significant number of new ions ($\ce{NH4^+}$ or $\ce{OH^-}$) are introduced into the solution. * The total concentration of current-carrying ions remains practically constant. * Therefore, the conductance curve flattens out into a **plateau** after the equivalence point. Step 5 - Evaluate the Options and Identify the Correct Graph * **Option (A) is incorrect:** This graph shows a drop followed by a rise, which represents a strong acid-strong base titration (e.g., $\ce{HCl}$ vs $\ce{NaOH}$). * **Option (B) is correct:** This graph perfectly represents the weak acid-weak base system: it starts at a low conductance value, rises steadily up to the equivalence point due to the formation of a strong electrolyte salt, and then plateaus out because excess weak base does not dissociate further. * **Option (C) is incorrect:** This graph shows a steady rise followed by a steep upward turn, which represents the titration of a weak acid against a *strong* base (where excess $\ce{OH^-}$ after the endpoint causes a steep increase). * **Option (D) is incorrect:** This graph shows an initial decrease in conductance, which is not characteristic of a pure weak acid-weak base reaction. $$\text{Correct Option: } \boxed{B}$$