Which of the following graph truly represents the titration of a solution containing a mixture of an — Electrochemistry Chemistry Question
Question
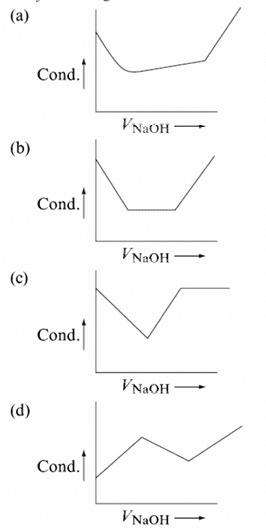
Which of the following graph truly represents the titration of a solution containing a mixture of $HCl$ and CH3COOH against $NaOH$ solution?
💡 Solution & Explanation
Step 1 - Understand the Principles of Conductometric Titrations The electrical conductance ($G$) of an electrolyte solution depends on two main factors: 1. The total concentration (number) of ions present in the solution. 2. The individual ionic mobilities (velocities) of these ions. Among all aqueous ions, the hydrogen ion ($\ce{H^+}$) and the hydroxide ion ($\ce{OH^-}$) have exceptionally high ionic mobilities because they conduct electricity via the Grotthuss proton-hopping mechanism: $$\lambda^\circ(\ce{H^+}) \approx 349.6\ \Omega^{-1}\text{ cm}^2\text{ mol}^{-1}$$ $$\lambda^\circ(\ce{OH^-}) \approx 199.1\ \Omega^{-1}\text{ cm}^2\text{ mol}^{-1}$$ In contrast, other typical ions like sodium ($\ce{Na^+}$), chloride ($\ce{Cl^-}$), and acetate ($\ce{CH3COO^-}$) have much lower ionic mobilities: $$\lambda^\circ(\ce{Na^+}) \approx 50.1\ \Omega^{-1}\text{ cm}^2\text{ mol}^{-1}$$ $$\lambda^\circ(\ce{Cl^-}) \approx 76.3\ \Omega^{-1}\text{ cm}^2\text{ mol}^{-1}$$ $$\lambda^\circ(\ce{CH3COO^-}) \approx 40.9\ \Omega^{-1}\text{ cm}^2\text{ mol}^{-1}$$ Step 2 - Analyze Phase 1: Neutralization of the Strong Acid (\ce{HCl}) Initially, the solution contains a mixture of a strong acid ($\ce{HCl}$) and a weak acid ($\ce{CH3COOH}$). Because $\ce{HCl}$ is a strong, completely dissociated electrolyte, it release a high concentration of free $\ce{H^+}$ ions, which also suppresses the ionization of the weak acid $\ce{CH3COOH}$ via the common ion effect. Thus, the initial conductance is very high. When the strong base $\ce{NaOH}$ is added, it reacts preferentially with the stronger acid ($\ce{HCl}$): $$\ce{H^+(aq) + Cl^-(aq) + Na^+(aq) + OH^-(aq) -> Na^+(aq) + Cl^-(aq) + H2O(l)}$$ During this phase, highly mobile $\ce{H^+}$ ions ($\lambda^\circ \approx 350$) are replaced by much less mobile $\ce{Na^+}$ ions ($\lambda^\circ \approx 50$). Consequently, the conductance decreases sharply up to the first equivalence point (representing the complete neutralization of $\ce{HCl}$). Step 3 - Analyze Phase 2: Neutralization of the Weak Acid (\ce{CH3COOH}) Once the $\ce{HCl}$ is completely neutralized, the added $\ce{NaOH}$ begins to react with the weak acid ($\ce{CH3COOH}$): $$\ce{CH3COOH(aq) + Na^+(aq) + OH^-(aq) -> CH3COO^-(aq) + Na^+(aq) + H2O(l)}$$ In this reaction, the unionized, poorly conducting $\ce{CH3COOH}$ molecules are converted into a highly dissociated strong electrolyte, sodium acetate ($\ce{CH3COONa}$), which releases $\ce{Na^+}$ and $\ce{CH3COO^-}$ ions. Although these ions have low mobilities, their total concentration increases continuously. This continuous increase in the overall ion population leads to a gradual and steady rise in conductance up to the second equivalence point (representing the complete neutralization of $\ce{CH3COOH}$). Step 4 - Analyze Phase 3: Addition of Excess \ce{NaOH} Beyond the second equivalence point, all the acids are fully neutralized. Any further addition of $\ce{NaOH}$ introduces excess free sodium ions ($\ce{Na^+}$) and highly mobile hydroxide ions ($\ce{OH^-}$) directly into the solution: $$\ce{NaOH(aq) -> Na^+(aq) + OH^-(aq)}$$ Since the ionic mobility of $\ce{OH^-}$ is extremely high ($\lambda^\circ \approx 200$), the concentration of these highly conducting ions increases rapidly, resulting in a sharp, steep upward rise in the conductance curve. Step 5 - Evaluate and Explain Each Option * **Option (A) is correct:** This graph perfectly captures all three distinct stages of the titration: a sharp drop due to the neutralization of $\ce{HCl}$ (replacement of $\ce{H^+}$ by $\ce{Na^+}$), followed by a gradual rise due to the neutralization of $\ce{CH3COOH}$ (formation of the strong electrolyte sodium acetate), and finally a steep rise due to excess highly mobile $\ce{OH^-}$ ions. The curve correctly displays two distinct break points corresponding to the two end points. * **Option (B) is incorrect:** This graph shows a sharp drop followed by a flat horizontal plateau and then a steep rise, which would correspond to a mixture titration where the second acid is not neutralized or a different set of weak electrolytes is used. * **Option (C) is incorrect:** This graph shows a flat plateau followed by a steep rise, which fails to show the initial sharp drop associated with the neutralization of $\ce{HCl}$. * **Option (D) is incorrect:** This graph shows a continuous downward trend or a different complex shape that does not match the thermodynamic behavior of this specific mixture titration. $$\text{Correct Option: } \boxed{A}$$