At critical temperature, which of the following graphs is correct? — States of Matter and Gaseous State Chemistry Question
Question
At critical temperature, which of the following graphs is correct?
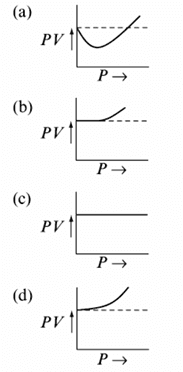
Answer: A
💡 Solution & Explanation
at the critical temperature, the critical isotherm has a point of inflection with a horizontal tangent at low pressures on a pv vs p plot. this flat starting region which then curves upward corresponds to graph (a).
💬Ask on WhatsApp →
Still have doubts about this question?
Send it to our AI chemistry tutor on WhatsApp — gets answered in minutes